Geokincern integrates, visualises and interprets data to address Earth Science problems
Traditionally data have been under-utilized for various reasons (e.g. poor quality, lack of metadata and provenance information and under-confidence in interpretation).
With a growing “open-source” toolkit, our ability to sort, tidy, analyse and visualise these data places more of us in a position to make well-informed decisions with a greater degree of freedom and control.
Now we can revisit old data with new tools and new ideas to challenge existing paradigms
Likewise, newer, better data are easier to access, from sources as diverse as government organisations, community-based developments and crowd-sourced projects.
From the largest corporation to the smallest business to the individual, we are now more empowered to seek out knowledge, make inferences and share our ideas than ever before.
And we are all a part of this process…
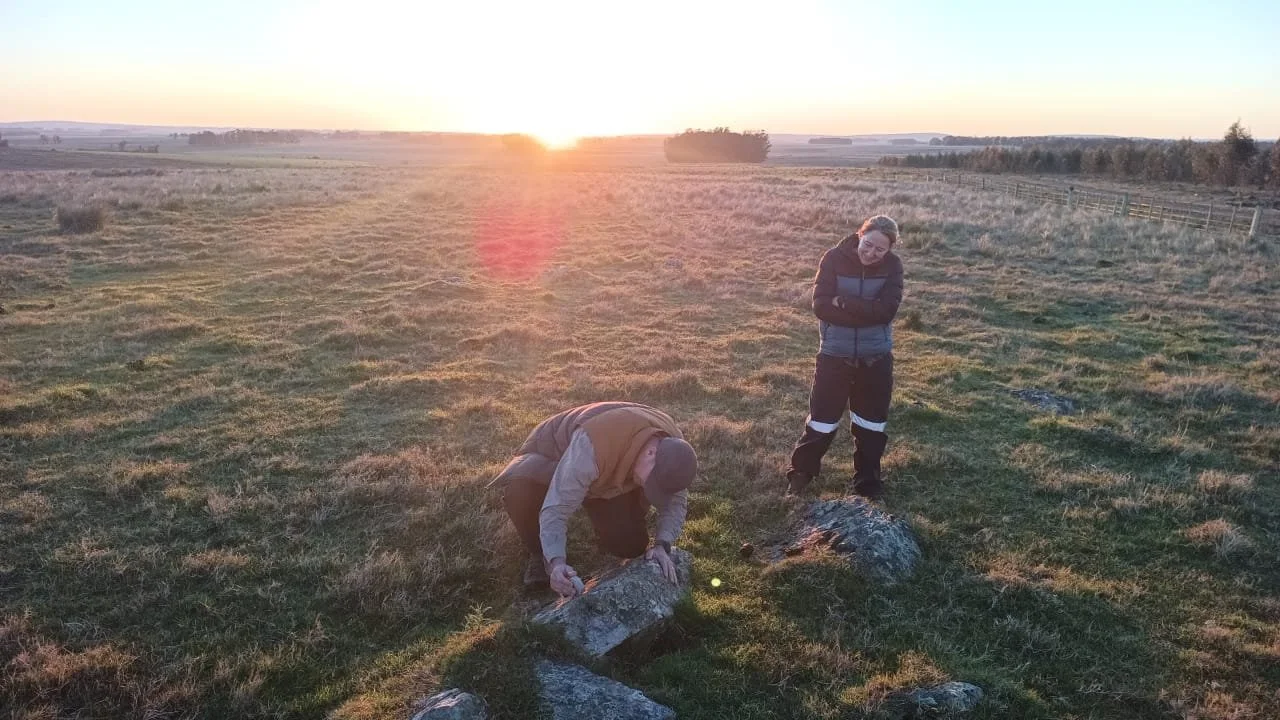
Geokincern Pty Ltd is a structural and geophysical interpretation company. It specialises in the integration of multiple datasets to produce litho-structural interpretations and three-dimensional models with the aim of generating robust exploration targets. With particular emphasis on advanced structural data acquisition and value extraction from geophysical data, Geokincern helps their clients minimise risk in their exploration efforts at all scales, from project generation through to near-mine environments.
Directors and Principal Consultants Dr. John Stewart and Dr. Helen Williams have a combined 45 years of experience in research, mineral exploration, and leadership in the fields of structural geology and geophysics. John and Helen have applied these skillsets to earth science and exploration problems across a wide range of commodities, building up an advanced understanding of the structural framework and geophysical signatures of many different deposit styles across many terranes globally.
Using multi-disciplinary datasets and innovative workflows, Geokincern has empowered clients to pursue technical excellence within timely, cost-effective and successful exploration programs.